Probability and Statistics for Everyday Life: A Friendly Guide for Confident Learners
We all use…
If you’ve heard “When will I ever use probability and statistics?” at the kitchen table, you’re not alone. Parents worry about exam performance and confidence; students worry that math feels abstract. The truth? We all use probability and statistics daily—deciding whether to carry an umbrella, comparing phone plans, interpreting sports stats, or reading health news.
In this easy-to-follow guide, you’ll learn:
- What probability and statistics actually mean (where they appear in daily decisions).
- How they show up in daily decisions (shopping, sports, weather, health).
- Simple strategies parents can use to support learning at home.
- Short, structured exercises (10–12 minutes each) to build skills fast.
What Do These Words Actually Mean?
- Probability: A way to measure uncertainty—how likely something is to happen.
- Example: A “60% chance of rain” means that on 6 out of 10 similar days, it rains.
- Statistics: A way to make sense of information—how we collect, summarize, and interpret data.
- Example: Looking at your child’s last five quizzes to see whether accuracy is trending up.
Probability And Statistics in Daily Life Examples
Weather & planning
- Probability: 70% chance of rain → pack a light raincoat; 20% → maybe just a cap.
- Mini skill: Convert probability to expected frequency (70% ≈ 7 days out of 10).
- On probability in real life (weather, sports, etc): Statology [Cuemath – Probability in Real Life] Cuemath
Shopping & discounts
- Stats: Compare unit prices to decide which pack is a better value.
- Mini skill: Calculate mean and percent savings (e.g., from AED 25 to AED 20 is a 20% drop).
Sports & performance
- Probability: What’s the chance a free-throw shooter hits 3 in a row if they’re 80% accurate? (0.8 × 0.8 × 0.8 = 0.512 → 51.2%)
- Stats: Use the median to judge “typical” performance when one game is an outlier.
Health headlines
- Stats sense: Distinguish relative risk (e.g., “risk doubled”) from absolute risk (e.g., 1% to 2%). That difference can completely change how worried you should be.
Why Homework Help Feels Hard (and How to Fix It)
The familiar evening scene:
Your child faces a question: “A bag has 4 red, 3 blue, and 3 green marbles. What’s the probability of picking a blue?” They recognize a formula but not the why. Meanwhile, terms like mutually exclusive, complement, and empirical probability feel like jargon. Frustration builds on both sides.
What’s really going on:
- Vocabulary overload before understanding.
- Jumping to formulas without a concrete context.
- No link to decisions students actually care about (games, shopping, sports, phone plans).
Fix the cycle: Start with concrete examples, run quick experiments, and connect every question to a real decision your child might face.
The Core Ideas (Explained Simply)
Probability basics (friendly language)
- Probability of an event = favorable outcomes ÷ total outcomes.
- Example: Blue marble = 3 blues ÷ (4+3+3) = 3/10 = 30%.
- Complement rule: Not A = 1 – P(A). If the rain chance is 60%, then the no rain chance is 40%.
- Independent events: Two coin flips don’t influence each other (HH, HT, TH, TT)
Statistics basics you’ll actually use
- Mean vs. Median: Mean can be pulled by big outliers (e.g., one very expensive month). Median often tells the “typical” case better.
- Mode: Most frequent value (great for shoe sizes or most common quiz score).
- Range & Variability: Two students both average 80%; one varies from 60 to 100, the other from 78 to 82. Which is more consistent? Variability answers that.
- Percent & Percentage points: Going from 20% to 30% is a 10 percentage point increase, which is a 50% relative increase. (Both statements can be true—know which one you’re using.)
Proven Ways Parents Can Support Learning
Strategy 1 — Start with a story, not a formula
Mini-story: “You have three playlists: Pop (40 songs), Lo-fi (30), and Jazz (30). Shuffle picks one at random. What’s the chance it’s Pop?”
Intuition: More pop songs → higher chance. Then do the math: 40/100 = 40%.
Strategy 2 — Make tiny experiments
- Toss 20 coins. Predict heads ≈ 10—record results. Compare theoretical (exact math) vs. experimental (what happened). Discuss why they might differ.
Strategy 3 — Visuals beat jargon
- Use pie charts or 10×10 grids to show percentages.
- Draw number lines to compare probabilities (0 to 1).
- For mean/median, line up data points and “balance” them.
10-Minute Exercise (Parents + Students)
Goal: Build intuition for “expected value.”
- Toss a coin 20 times and record heads (H) and tails (T).
- Predict: “I expect ~10 heads.”
- Calculate: What fraction are heads? What’s the difference from 0.5?
- Talk: Does a small sample always hit 50%? (No—variation is normal.)
Fractions, Decimals, and Percentages: An Easy Way to Understand Their Relationships
Common Student Problems (and Quick Fixes)
“I memorized a formula, but I don’t get the question.”
- Fix: Ask, “What’s the story here?” Restate the question in plain language before computing.
“I mix up mean, median, and mode.”
- Fix: Think Mean = “Mathematical average,” Median = “middle when sorted,” Mode = “most often.”
“I think probability means guarantee.”
- Fix: Use repeatable experiments (dice, coin flips) to feel the long-run idea.
“Tree diagrams and tables confuse me.”
- Fix: Start tiny (2 choices, then 3). Use color coding to separate branches and outcomes.
Short, Structured Home Exercises (with time estimates)
Exercise 1 — Spinner Sense (Grades 3–6)
- Draw a circle and split into 4 equal sections: red, blue, green, yellow.
- Predict: In 40 spins, how many times should each color appear?
- Spin (or simulate): Use a paperclip spinner or a random number generator (1–4).
- Compare & Reflect: Actual counts vs expected (10 each). Variation is normal.
Time: 12 minutes
Exercise 2 — Family Data Dashboard (Grades 5–9)
- Track one week of a real measure (steps, screen time, pages read).
- Compute mean, median, and range. [Medium – Statistics in Daily Life]
- Draw a bar chart or dot plot.
- Discuss: Which average best represents the week? Why?
Time: 15 minutes (or split across days)
Exercise 3 — Card Challenge (Grades 6–10)
- Use a standard deck (or 20 random cards).
- Question: What’s the probability of drawing a red card, then a black card without replacement?
- Solution sketch: P(red) = 26/52 = 1/2; then P(black | first red) = 26/51 ≈ 0.5098; multiply ≈ 0.2549 (~25.5%).
- Extension: Try with replacement—how does that change things?
Time: 10 minutes
How Private Tutoring Builds Confidence (Fast)
What changes with a specialist?
- Personalized gaps-first approach: A tutor diagnoses misconceptions (e.g., confusing “likely” vs. “certain”) and fixes them with targeted practice.
- Dual-track progress: Concept mastery and test readiness—worked examples, timed drills, reflection.
Mini success snapshot
- Week 1: Student gets ~6/10 on short probability quizzes; misreads multi-step questions.
- Week 3: After two 45-minute sessions/week focusing on visuals and language, accuracy rises to 8/10, with fewer “careless” errors.
- Week 5: Student explains mean vs median confidently and chooses the right measure in context (e.g., ignoring an outlier).
A short success story
Amir, a Year 9 student, felt lost reading sports stats and probability word problems. In four weeks, we:
- replaced jargon with visuals,
- practiced with favorite sports examples,
- used 10-minute drills three times a week.
Result: He began explaining why answers made sense, not just what button to press. His quiz scores rose steadily—and his anxiety dropped.
Why it worked: Personalized pacing, relatable contexts, immediate feedback, and a clear weekly routine.
Quick Wins with Probability & Statistics
Shopping smart
- Compare two “50% off” deals when one has shipping or a higher base price. Build a tiny total-cost table. Choose the real winner.
Sports predictions
- Check the last 10 games (wins/losses, points). One outlier can skew the mean—try the median for stability.
Weather planning
- If rain is 40% and you’re walking 30 minutes, what’s your “umbrella policy”? Set a personal threshold (e.g., carry one at ≥50%).
Health headlines
- Translate “risk reduced by 25%” into absolute terms. If risk goes from 4/100 to 3/100, that’s 1 fewer person per 100. Clarity builds trust.
Probability And Statistics Exercises for Parents and Students
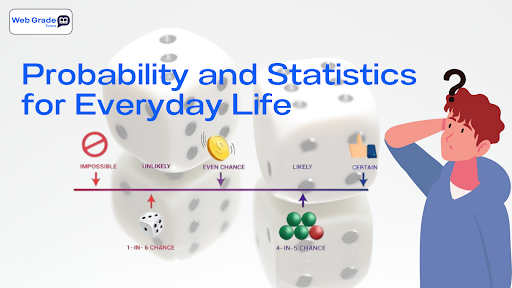
Dice Doubles (Grades 3–6)
Roll two dice 30 times. Count doubles (1–1, 2–2, …).
- Expected: 6/36 = 1/6 of rolls (~5 out of 30).
- Time: 8–10 minutes.
- Expected: 6/36 = 1/6 of rolls (~5 out of 30).
Budget Basket (Grades 5–9)
List 5 snack options with prices. Create two bundles under a budget.
- Compare mean cost per item and % savings vs buying individually.
- Time: 10–12 minutes.
- Compare mean cost per item and % savings vs buying individually.
News Detective (Grades 7–10)
Find a headline with a number (e.g., “risk doubled”).
- Ask: “What’s the baseline?” Reframe as absolute change.
- Ask: “What’s the baseline?” Reframe as absolute change.
Time: 10 minutes
A Simple Weekly Study Plan (Parents + Students)
- Mon/Wed/Fri (10–12 min): One quick probability or stats exercise (coin/dice experiment, sale comparison, median check).
- Weekend (30–40 min): Deeper topic (e.g., independent vs. dependent events) using visuals, then 5 practice questions.
- Weekly reflection (5 min): Write one “aha!” sentence (“Median was better than mean because…”). This cements learning.
Need a ready-made plan with tracking and short checkpoints? Book a free trial lesson at WebGrade Tutors.
Online Tutoring That Fits Busy Families (US/UK/CA/AUS/NZ/Middle East)
Flexible scheduling across time zones.
Short, focused sessions (60 minutes) with screen-share and whiteboard.
Homework alignment so practice maps directly to school goals.
Affordability options with targeted packages (skill-boosting short-term or long-term support).
Replayable explanations: Digital notes, shared whiteboards, and recorded steps.
Cost control: Choose weekly packages or targeted “exam sprint” bundles.
Want a tailored plan? Book a free trial lesson at WebGrade Tutors.
Conclusion
Understanding probability and statistics is not just about formulas—it’s about making sense of the real-world chances we face every day. When learners recognise how likely things are and learn to interpret data with confidence, they gain more than exam success—they gain smart decision-making for life.
Next step: Book a free trial lesson at WebGrade Tutors and get a personalized learning plan for probability and statistics.
Frequently Asked Question?
It means using the tools of probability in daily decisions (like weather, shopping, sports) and using statistics in everyday life (like averages, trends) so that learners become confident in interpreting data.
Because it builds confidence learners by showing how math links to real life, improves decision-making skills, and helps with exam readiness and broader reasoning.
Use short structured exercises (10-12 minutes), connect questions to real-world chances, and guide your child through concrete examples rather than jumping straight to the formula.
Absolutely! At WebGradeTutors, we match you with a tutor who specializes in your subject area and understands your unique learning needs. Whether you need help with GCSE math, A-Level physics, SAT/ACT prep, or ELA, we’ll connect you with the best tutor for your goals.
Use the formula: favorable outcomes ÷ total outcomes. This is foundational when you apply probability for students in contexts like drawing cards or picking a marble.
When students understand probability in daily decisions, they can assess risks, compare options, recognise misleading averages, and make choices based on real data—turning uncertainty into clarity.